
Once management have been continued of the needs for change and all employees made aware of the reasoning for the charge initiative, it is essential for everyone to have relevant knowledge or ability to use basic problem-solving tools.
This is a graphical representation of a process showing the relationships among process steps. It uses a set of symbols to document the process steps, presenting them in a pictorial format that is easy to understand.
FLOW CHARTS
SYMBOLS NAME Function
Start/ End Represent start and end point.
Arrows Connector shows relationship.
Input/ Output Parallelogram represents Input/output.
Process A rectangle represents a process.
Decision Diamond indicates a decision.
Is without doubt the most fundamental of all pre-solving analytic tools. It is a way of generating large number of ideas from a graph of people in short period of time.
Structured approach required in Brainstorming: –
Histogram may be thought of as bar chart and shows patterns of variation. This is a vertical bar chart showing how often a particular variable state occurred with the height of cash column representing the relative frequency.
Histogram are useful when presenting projects data to stakeholder as they can give a clear indication of which problem are most important to tackle.
The histogram involves following steps for its construction: –
As known as tally sheets and may be used as the checklist when collecting data, they are used to organize facts in a manner that will facilitate the effective collection of useful data about a potential quality problem and are especially useful for gathering attributes data while performing inspection to identify data.
Cause Effect Diagrams/Ishikawa or Fish-bone Diagram
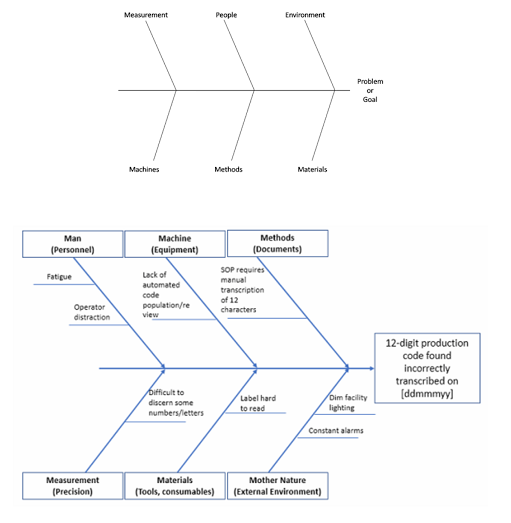
1. Useful in helping us to understand the root causes behind our problem.
2. The technique consists of defining a problem (or effect) which occurs in the workplace & needs to be changed or corrected.
3. After defining effect, the factor contributing to it are required (causes). While these are possibly one or two causes of a problem. These are probably many potential causes.
4. The factors which many affect any process can be:
a. Man
b. Machine
c. Material
d. Environment
5. These are input & affect will be output. Errors in output are the causes of the problem I.e., Effect.
6. This is not a statistical technique and is therefore applicable in almost all types of projects.
7. Its critics precisely because it is not quantitative & require a lot of subjective analysis and judgement.
8. Strengths are helps to make sense of a situation where there are a lot of variables that are interacting with each other and it is also a powerful visual tool to explain your analysis to others.
9. Disadvantage of critics: Its critics precisely because it is not a quantitative approach or it is not a statistical technique. So, require a lot of subject analysis & judgement.
Here the data is displayed as a collection of point, each having the value of one variable degerming the position or horizontal axis & the value of the other variable degerming on the vertical axis.
A scatter diagram can suggest various kinds of correlation between variable with a certain correlation level. Correlation may be:
Then align of best fits can be in an order to study the correlation between the variables.
Meaning: “Degree of excellence.”
Customer: who uses your output.
1. Internal: Who are internal to the organization
2. External
3. Consultant (supplier)– Sr Resident/Resident = Nurse
Supplier= Customer
Boundry Identifying customer
4. Leaders to develop business & working process that incorporate best practices & establish National performance measures.
Planning – Collection of data – Analysis of data – Implementation – Evaluation / monitoring
Data analysis & data presentation is usually done in graphical format to easily identify the effective technique to improve one’s own company’s status or activities.
Implementation include the phrase walk. It involves implementation of the action plan develop to minimize gap between ideal & actual performance.
Evaluation & monitoring should be done by using systematic evaluation to get the maximum benefit of benchmarking process.
Five reasons for actively using techniques are:
Control Chart: Is this process variance within acceptable limbs?
The pattern of data points on control chart may reveal random functioning values, sudden process jump, a gradual trend in increased variation, by monitoring the output of a process.
From proceeding – customer supplies – output of supplier – customer supplier – to next customer
External customer = End user of the product or service in hospital, it is patient.
Key concepts behind TQM:
Elements of TQM
a. Team work
b. Customer focus
c. Process orientation
d. Attribute for continuous improvement
Focus of TQM
Aspects of TQM
Componentes of TQM
TQM + Process
Approaches
TQM: The strategic elements
1. Quality improvement groups
a. Education & training
b. Suggestion schemes
c. Reward recognition
d. Attitude change
e. Culture change
f. Management development
g. Team building
2. Statistical quality control
a. Process capability
b. Inspection capability
c. Design for manufacture assembly
d. Manufacturing technology
e. Material technology
f. Information technology
g. Product technology
3. Organization structure & systems
a. Steering groups & companies
b. Quality & management audits
c. Supplies development
d. Cost of quality analysis
e. Quality function development
f. Customer surveys
g. Departmental purpose analysis
h. Business process management